Navigating shipping with advanced intelligence and expert insights
Shipping is the lifeblood of global supply networks, enabling the efficient transport of fuels, raw materials, finished goods and more across the globe.
Our Interactive Map and Shipping App deliver the commercial intelligence and real-time information you need to build a holistic, global snapshot of this dynamic landscape:
Keep pace with unfolding developments across the shipping industry in real time.
Leverage advanced visualisation tools to develop a clear picture of what is happening – on the water, at port and across the supply chain – at any given time.
View both current and historical content and research company fundamentals alongside real-time feeds of news, vessel positions, vessel employment and other developments.
From comprehensive data on maritime decarbonisation initiatives and market value data for the entire commercial fleet, to risk recommendations and competitor insights, our powerful data and tools equip you to addresses the challenges that define the shipping space.
Key figures
-
We monitor3900ports, 7800 berths and 600 anchorages.
-
We track~117 000ships, with ~200 vessel characteristics.
-
We track> 7 billion tonnestonnes of cargoes (out of ~11 billion of global trade).
-
We carry240 000shipping analytics time series.
Features & benefits
Our powerful suite of tools can help you to address the challenges that define the shipping space
Access powerful commercial intelligence
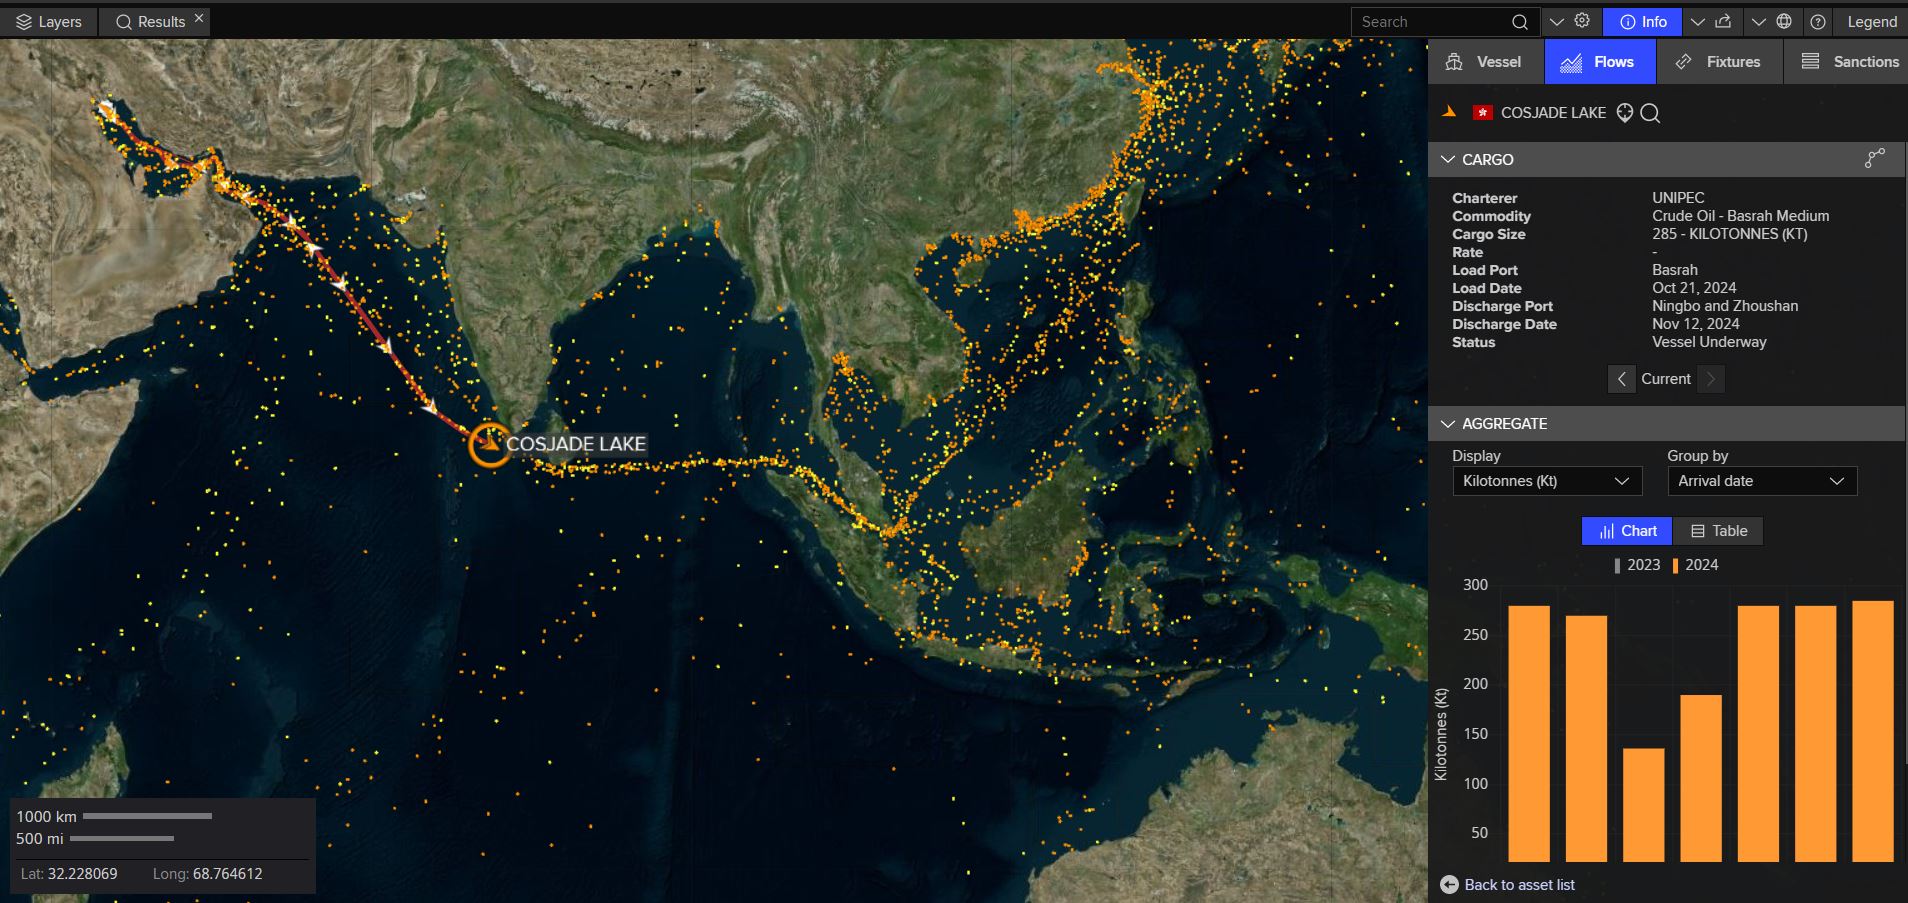
Comprehensive, real-time information allows you to visualise where individual vessels are, what’s on them and where they are headed. This helps you to build a holistic, global picture of current events.
Leverage advanced shipping analytics
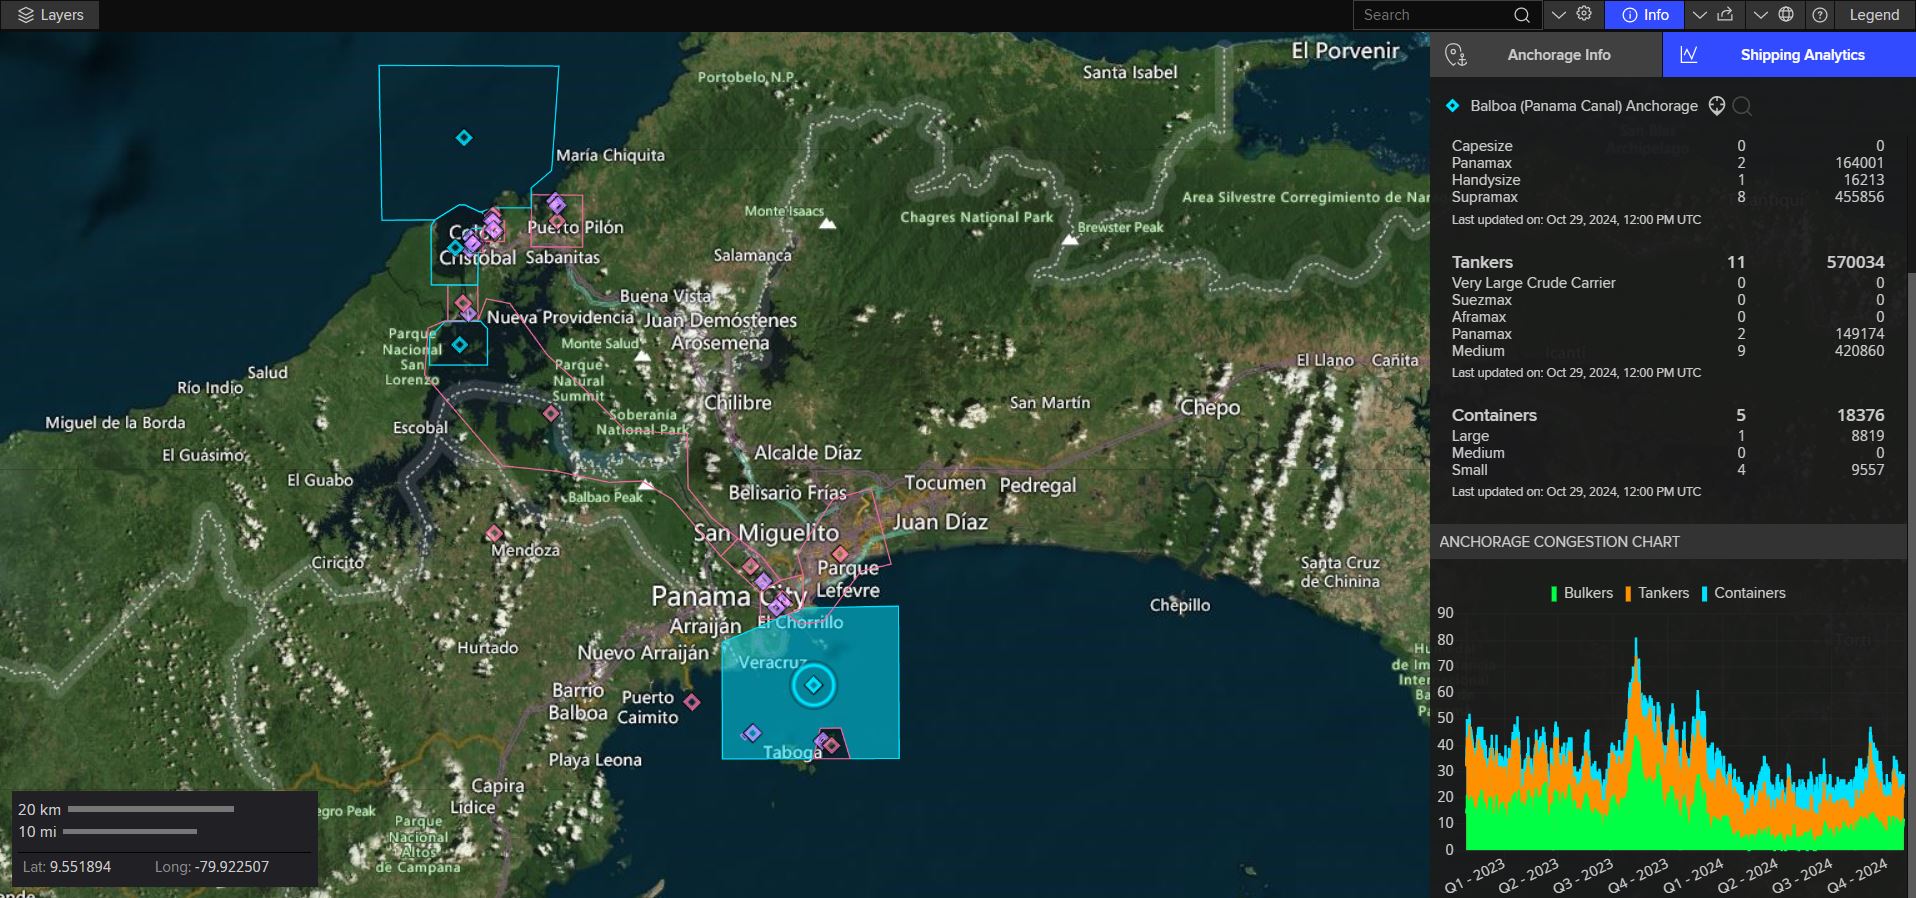
Monitor important developments and make informed decisions with our advanced insights and analytics.
Participate in maritime decarbonisation initiatives
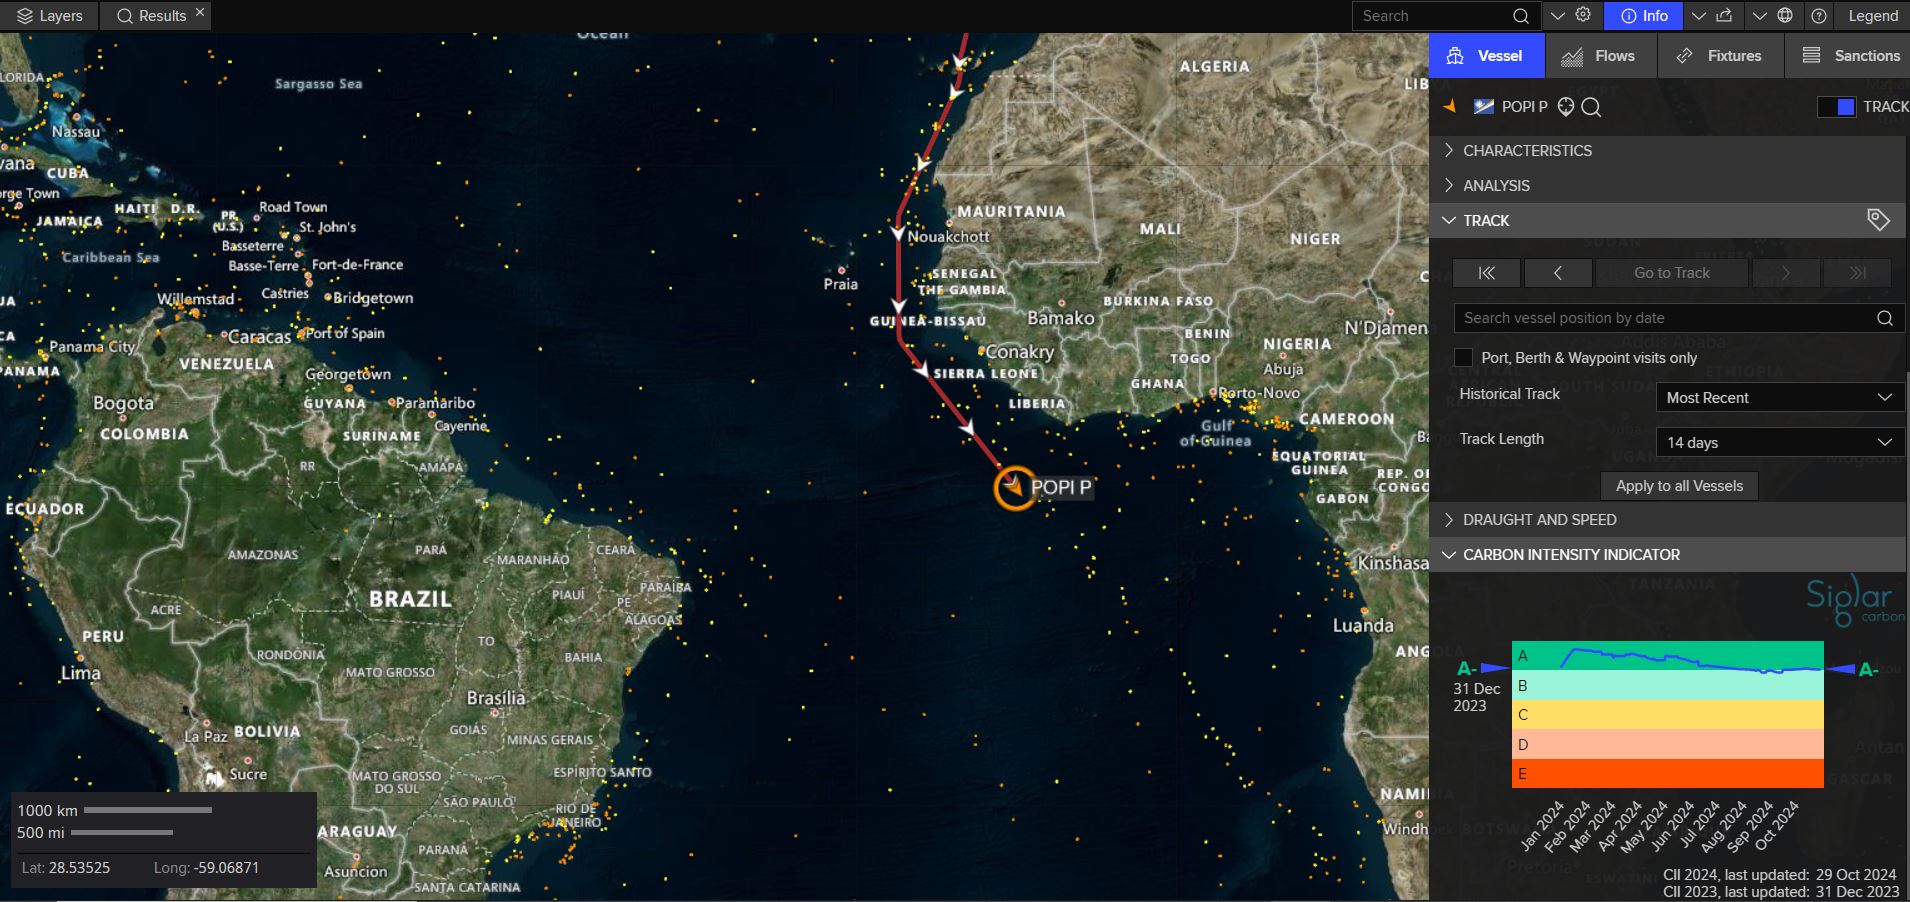
Understand the energy efficiency of different vessels.
Reduce maritime risk
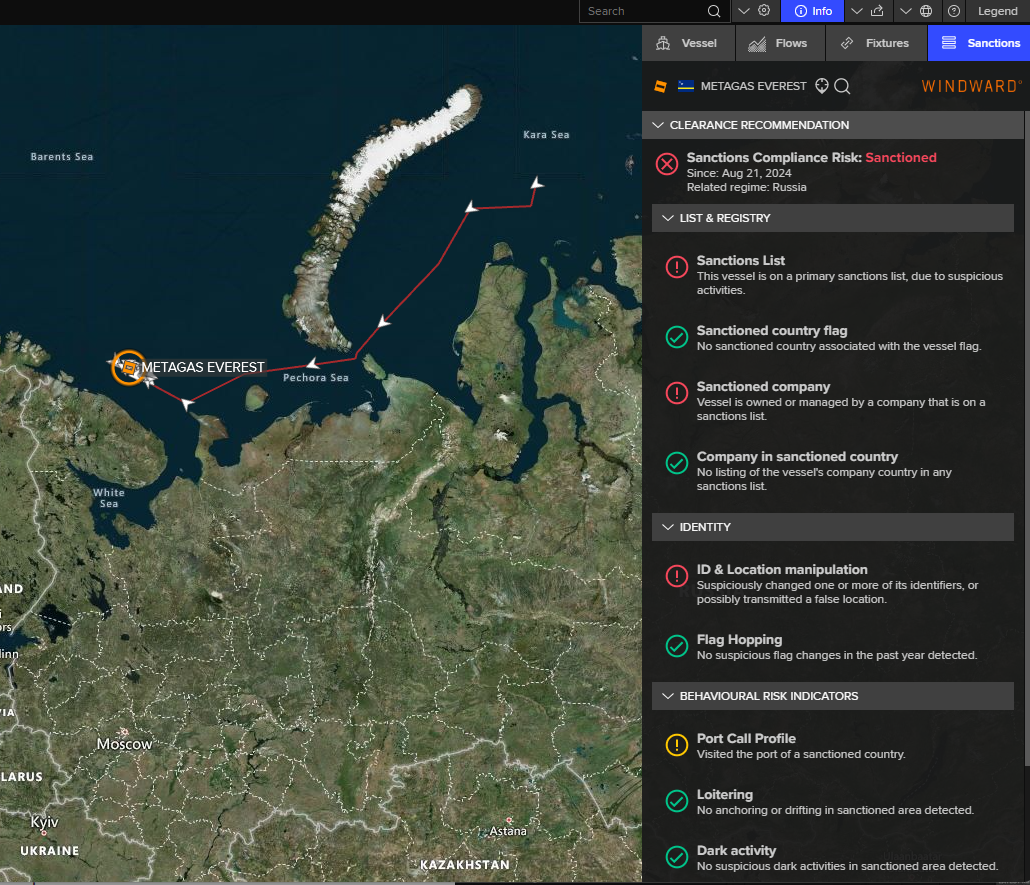
Access insightful sanctions compliance risk recommendations.
Tap into the full range of our broad financial content
View real-time, listed shipping stock price movements with click-through access to detailed financial information on companies.
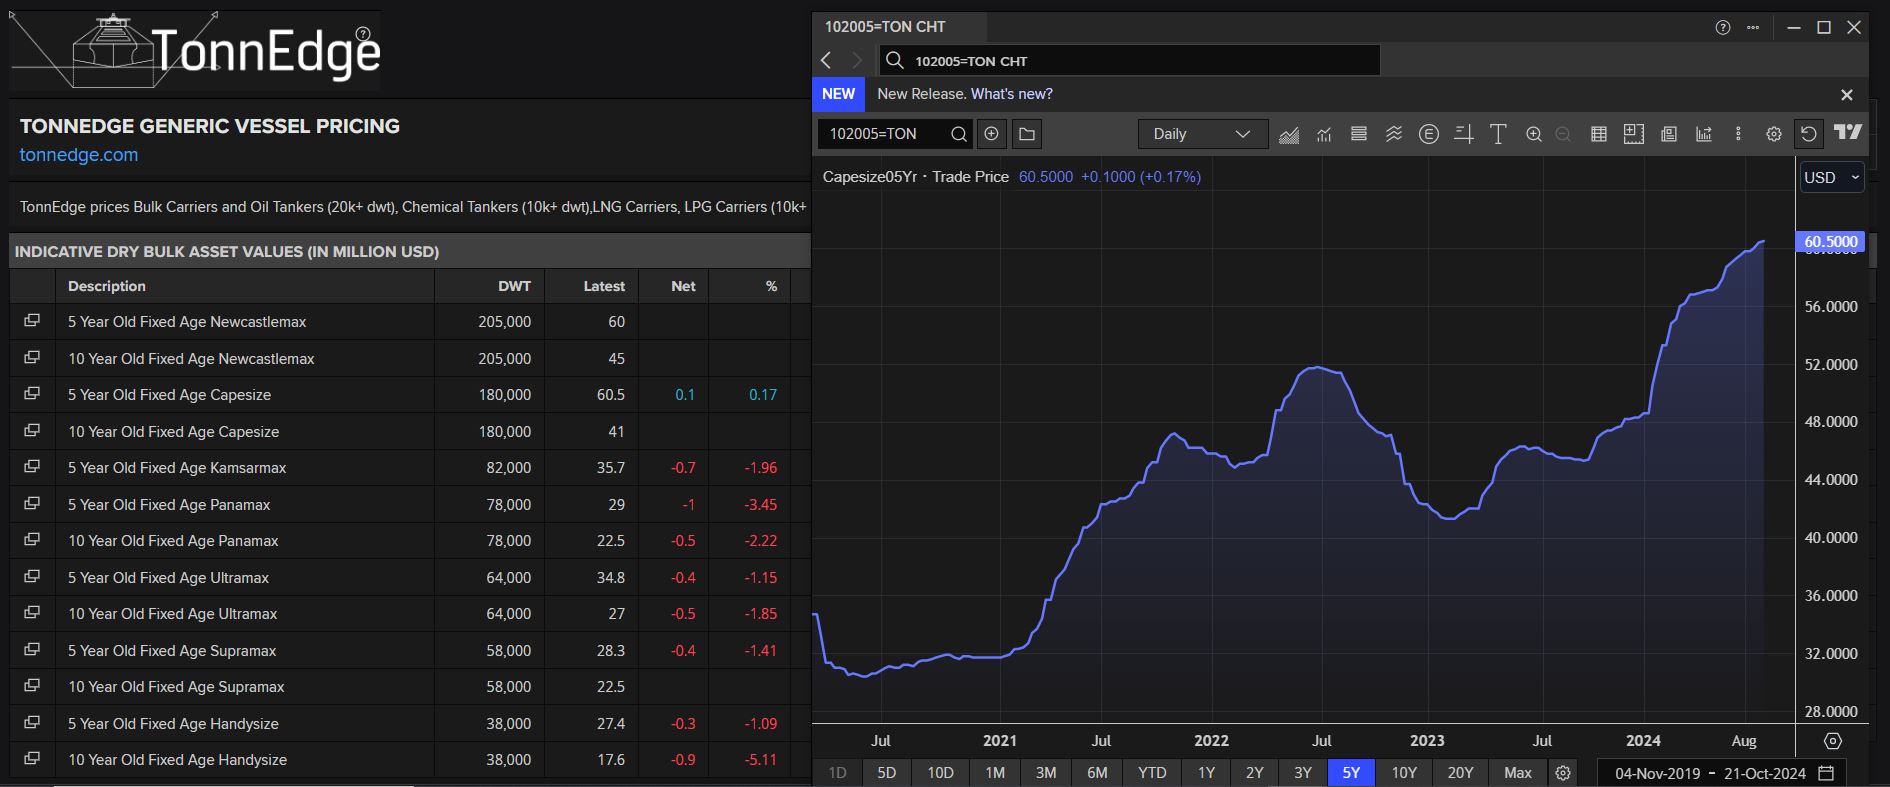
Understand the market value of your ship

Access accurate pricing for the entire commercial fleet and know the true market value of your own ships at any given time.
Benefit from integration with Microsoft Excel, LSEG Data Libraries for Python, Interactive Map and powerful charting tools
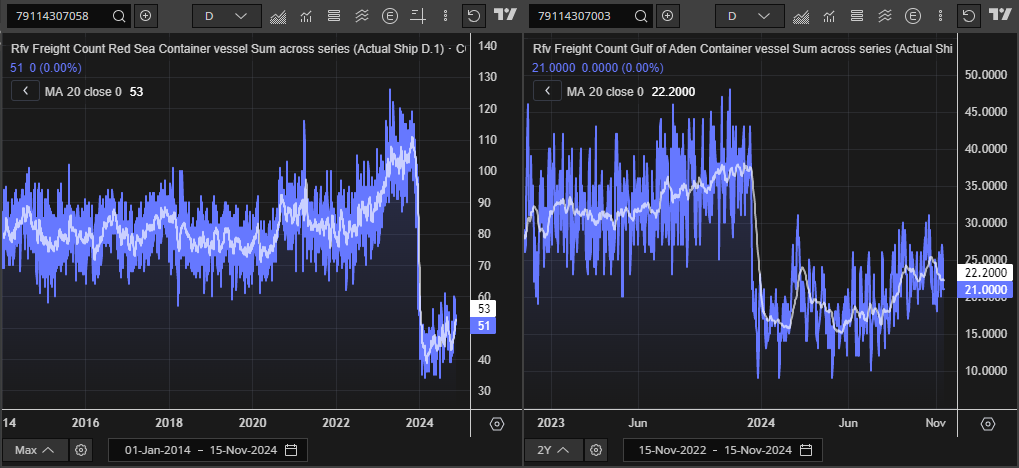
Import information directly to Excel or integrate it with other content for deeper insights and analysis. Quickly analyse the impact of different data points; track vessels and their cargoes; monitor port activity and weather – as they occur. Visualise a variety of scenarios with our advanced charting tools.
Our partners
Siglar Carbon

Windward
TonnEdge
Product in action
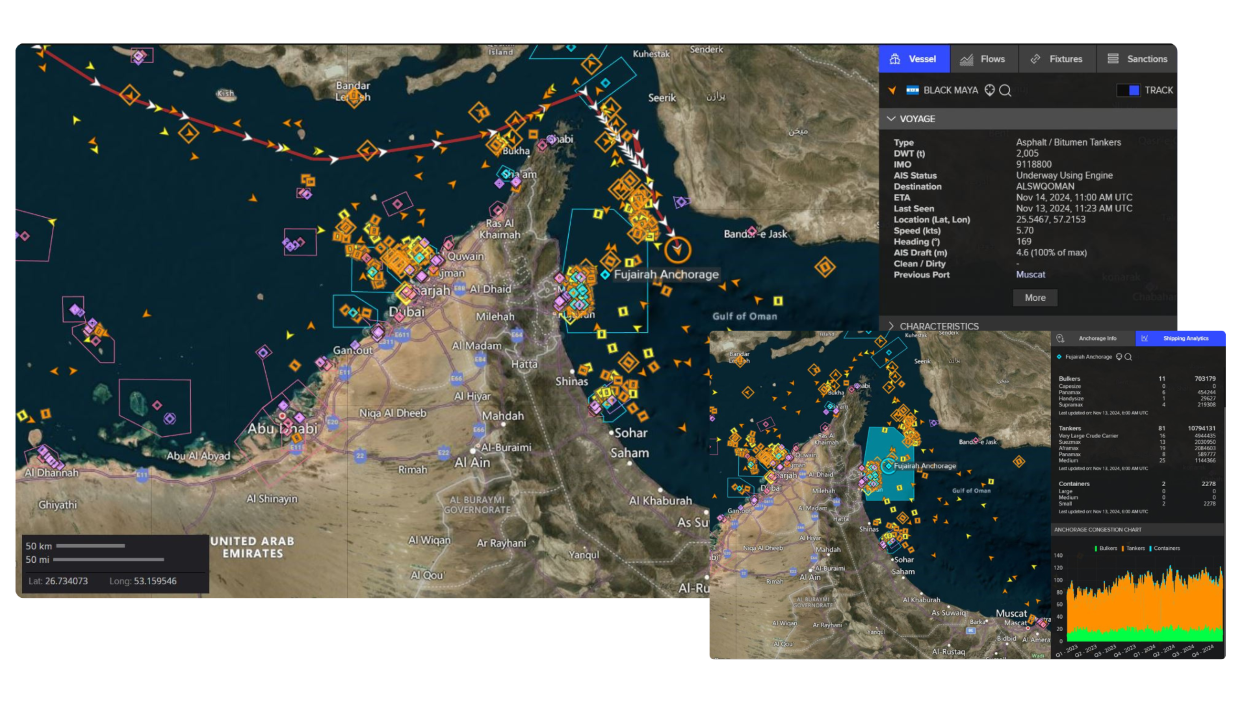
- Interactive Map deliveres integrated fixture and flows data alongside vessel tracking, allowing you to develop a deeper understanding of supply chain dynamics.
- Develop a deep understanding of shipping supply chain dynamics:
- Quickly assimilate a view of the entire supply chain
- Track competitor activity
- Filter data by vessel category, size, clean or dirty, and more
- Monitor vessel activity (port entry and exit, ETA, destination change and more)
- Locate infrastructure facilities related to your business needs
- Access analytic features such as speed analysis and vessel fixed or open status
- Screen your fleet based on dynamic CII ratings
- Transfer map data directly to Excel for deeper analysis or to generate quote lists
- Access sanctions compliance risk recommendations
Request product details
Call your local sales team
Americas
All countries (toll free): +1 800 427 7570
Brazil: +55 11 47009629
Argentina: +54 11 53546700
Chile: +56 2 24838932
Mexico: +52 55 80005740
Colombia: +57 1 4419404
Europe, Middle East, Africa
Europe: +442045302020
Africa: +27 11 775 3188
Middle East & North Africa: 800035704182
Asia Pacific (Sub-Regional)
Australia & Pacific Islands: +612 8066 2494
China mainland: +86 10 6627 1095
Hong Kong & Macau: +852 3077 5499
India, Bangladesh, Nepal, Maldives & Sri Lanka:
+91 22 6180 7525
Indonesia: +622150960350
Japan: +813 6743 6515
Korea: +822 3478 4303
Malaysia & Brunei: +603 7 724 0502
New Zealand: +64 9913 6203
Philippines: 180 089 094 050 (Globe) or
180 014 410 639 (PLDT)
Singapore and all non-listed ASEAN Countries:
+65 6415 5484
Taiwan: +886 2 7734 4677
Thailand & Laos: +662 844 9576
